
This is the main result from the climate summary stated in the ACF-10 Consensus statement, for temperature and precipitation during the Summer 2022, and sea ice for September 2022. View the full climate summary presentation for more details.
Temperature summary for the Summer 2022
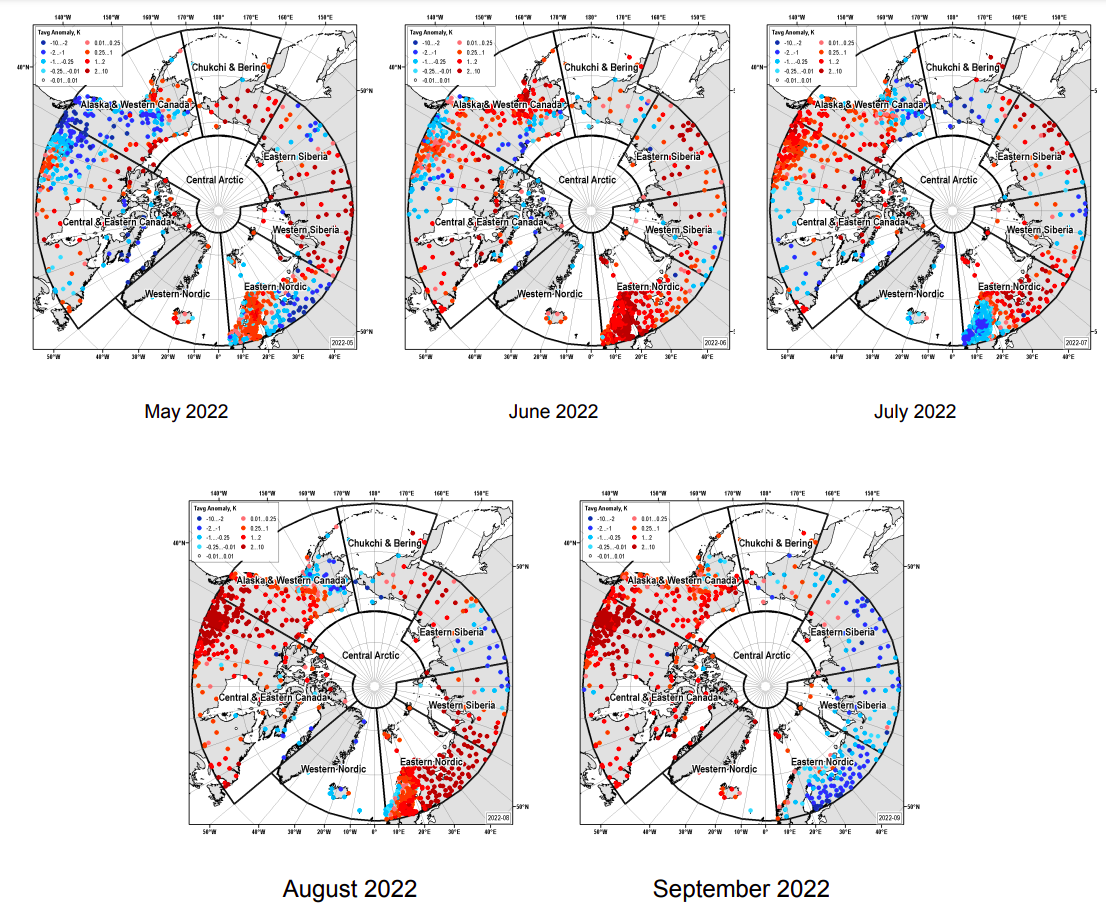
The figure below shows May – September 2022 monthly averaged SAT anomalies from the reference period 1991-2020 based on observations at polar stations. The maps are produced by the Arctic and Antarctic Research Institute Note: information for the stations outside of the ArcRCC-N domain is not shown.
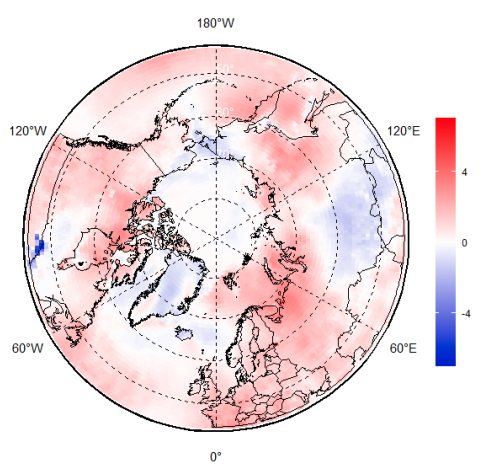
The figure below shows June, July and August (JJA) 2022 surface air temperature anomaly based on the 1991-2020 reference period. Red indicates warmer than normal temperatures, and blue indicates cooler than normal temperatures. The map is produced by the Arctic and Antarctic Research Institute http://www.aari.ru with ERA-5 as data source.
Click image to see forecast and climate summary side by side.
×
Forecasted temperature for June, and August 2022.

Temperature summary for the same period.
At the start of the Summer 2022 (May - June), strong positive anomalies of the surface air temperature occurred in Western (3rd – 5th in row) and Eastern Siberia (12th – 6th in row). For Alaska and Western Canada (31st – 5th) anomalies switched from strong negative to strong positive. Other strong positive anomaly occurred in May in Chukchi and Bering (2nd in row). During mid-summer (July - August) strong positive anomalies were observed over the Eastern Nordic in August (3rd in row), Western and Eastern Siberia (5th - 7th in row) and extremely positive – in the Central and Eastern Canada (5th – 1st in row). Negative anomalies were observed in July in the Western Nordic region (37th in row). By the end of summer in September 2022 similar extremely positive anomalies occurred over the Central and Eastern Canada (2nd in row) and Western Nordic (6th in row), while the Eastern Nordic (44th in row), Western (45th in row) and Eastern Siberia (48th in row) experienced negative anomalies. Due to lack of surface marine observations, conclusions for the Central Arctic were done using the reanalysis and included partly colder conditions in May 2022, close to normal in June – August and colder in September 2022.
For the whole land Arctic during May – September 2022 period only positive anomalies occurred with extremes in June (4th in row) and August (1st in row). Preliminary resulting rank for JJA 2022 for the land Arctic is the 2 nd in row (from 1950), though large interregional (not shown here) and inner seasonal variations and changes in anomaly sign do occur. Opposite to winter conditions (when the comparable positive anomalies also occurred in 1920s), the summer months of the 2010s-2020s Arctic experience 2-4 times greater positive anomalies than in 1910s-1920s, but that is again NOT the SAME for all ArcRCC-N regions. Scale of the actual anomalies depends on the WMO reference period chosen and density of the stations network in time, in particular for the marine Arctic.
Precipitation JJA 2022 Summary
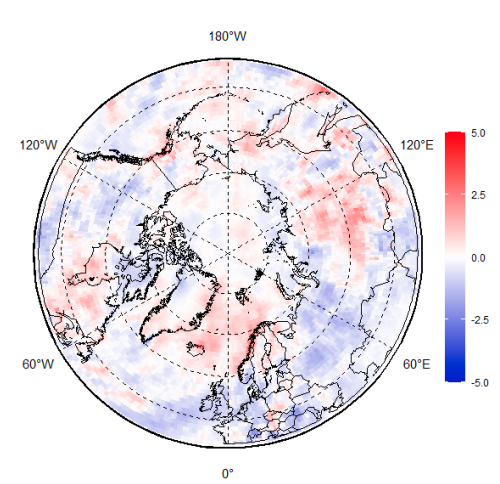
The figure below shows JJA 2022 precipitation based on the 1991-2020 reference period. Red indicates wetter than normal conditions, and blue indicates drier than normal conditions. The map is produced by the Arctic and Antarctic Research Institute http://www.aari.ru with ERA-5 as data source.
In general, during the Summer 2022 season wetter conditions dominated over most parts of Western Nordic, Eastern Siberia, Chukchi and Bering and Eastern Canada regions. Drier conditions dominated over Western Siberia and Central Canada. Eastern Nordic, Alaska and Western Canada, Central Arctic regions experienced both wetter and drier conditions.
Click image to see forecast and climate summary side by side.
×
Forecasted precipitation for June, July and August 2022.
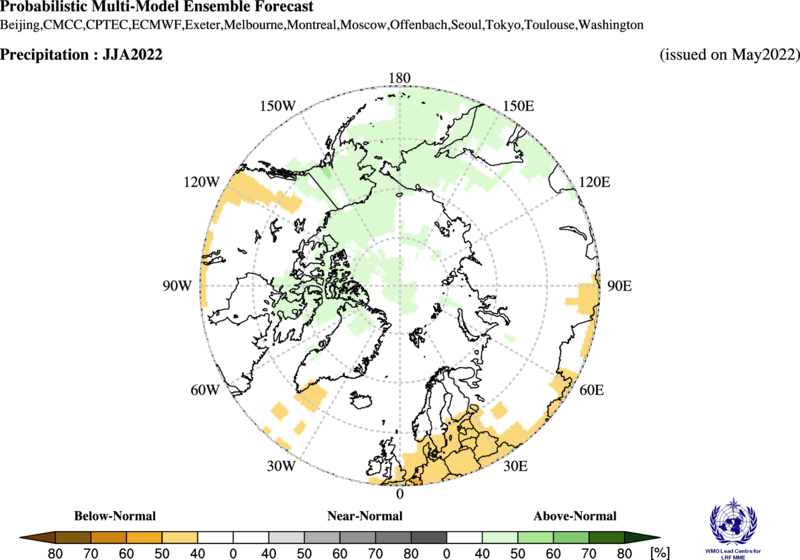
Precipitation summary for the same period.
Sea Ice Summary for September 2022
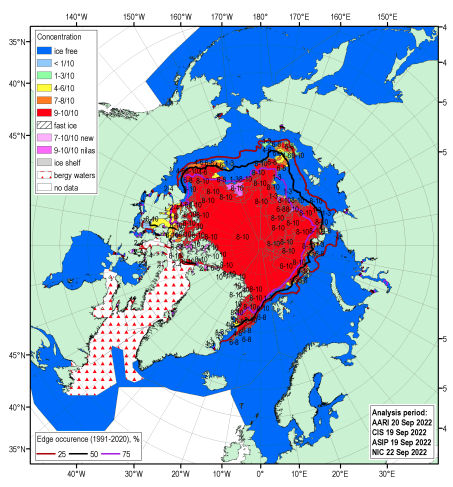
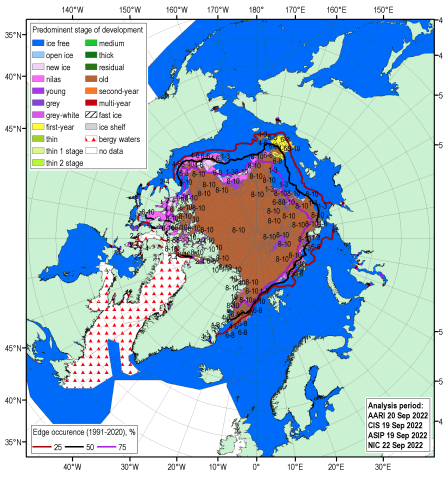
The figure below shows the blended Arctic ice chart (AARI, CIS, NIC, NOAA ASIP) for 19-22 September 2022 and sea-ice edge occurrences for 15-20 September (reference 1991-2020) for total concentration (top) and predominant stage of development (bottom).
Negative and close to normal ocean heat capacity (HC) anomaly (to 1993-2020 and more important - to 2020, not shown here) in upper 15m layer during June 2022 for most of the Arctic slowed ice melt in these regions which is similar to 2021, with exceptions in the Barents and North-Eastern parts of the Kara Seas. Further in season, dominance of positive surface air temperature anomalies over Western Eurasian Arctic, Laptev Sea, Hudson Bay and Canadian Archipelago stimulated ice melt, however, opposite negative or zero anomalies preserved ice cover in parts of Eastern Siberia and Beaufort Seas. Resulting ice conditions in September 2022 resembled the previous year situation including the minimum ice extent which is again strongly opposite to 2019 and 2020.
The general ice conditions observed in September 2022, are very similar to that for 2021 and for second time in row significantly differ from 2019 or 2020. While Eurasian Barents, Kara (that is opposite to 2021) shelf seas were completely ice free with the ice edge significantly northward of Svalbard, the ice conditions in parts of the Laptev, Eastern Siberia, Beaufort Seas were close to 40 years normal with both the North-West Passage and the Northern Sea Route formally remaining blocked in the transit straits which is again opposite to last pentade. Area and thickness of both residual and second year ice in September this year for the Arctic Basin was similar as in 2021 as recorded during summer cruise by the AARI research vessel “Akademik Treoshnikov”. Estimate of the total Arctic ice volume in September 2022, based on numerical modelling (DMI, see polarportal.dk) is close to the 3rd - 4th lowest (ref. 2004-2022) after 2019-2021 (not shown here).
No long-range forecast for these sea ice charts for this period.