
This is the main result from the climate summary stated in the ACF-7 Consensus statement, for temperature, precipitation and sea ice during February, March and April 2021. View the full climate summary presentation for more details.
Temperature FMA 2021 Summary
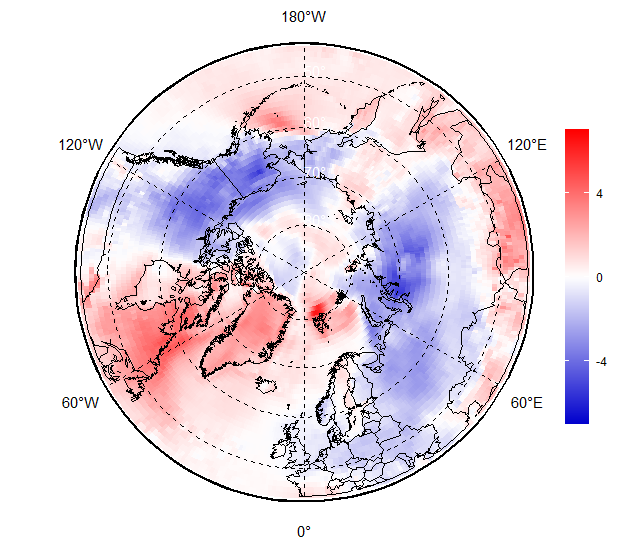
The figure below shows February, March, and April (FMA) 2021 surface air temperature (SAT) anomaly based on the 1991-2020 reference period. The map is produced by the Arctic and Antarctic Research Institute with ERA5 as data source. The imaged can be clicked to show the forecast temperature for the same period.
Average surface air temperatures in the Arctic were above normal over parts of the Sea of Okhotsk, Bering Sea, Eastern Canada, Greenland and Svalbard (red areas in the figure below), while very strong negative anomalies were observed over eastern parts of Nordic region, Siberia and Alaska (blue areas in the figure below). In general positive linear trends for winter temperatures continued for all Arctic seas, while for the land regions greater interannual variability was observed. Assessment of the bioclimatic weather severity using Bodman’s index (linear combination of SAT and wind speed, not shown here) indicates that in Canada and Alaska milder than for the last 30 years weather in January 2021 switched to a more severe one in February 2021. Similar situation was observed for February – March for Central and Eastern Siberia while Nordic region experienced milder weather in January 2021 and more severe in April 2021.
Click image to see forecast and climate summary side by side.
×
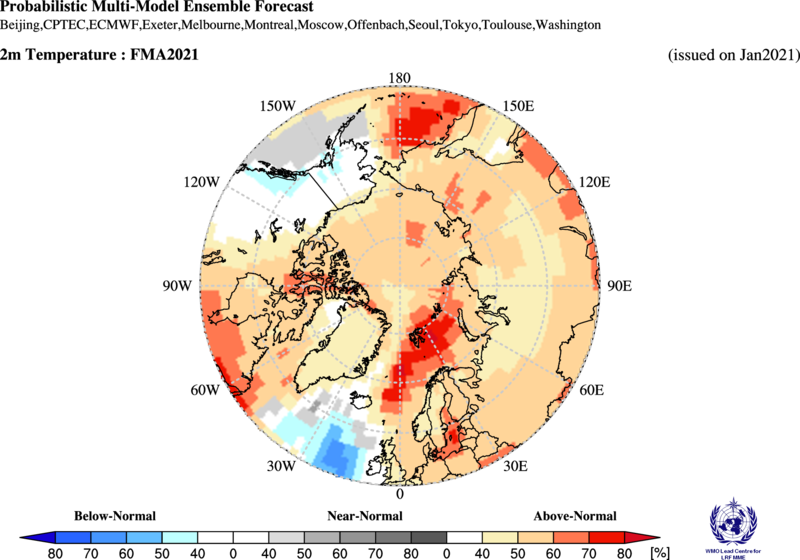
Forecasted temperature for February, March and April 2021.
Temperature summary for the same period.
Precipitation FMA 2021 Summary
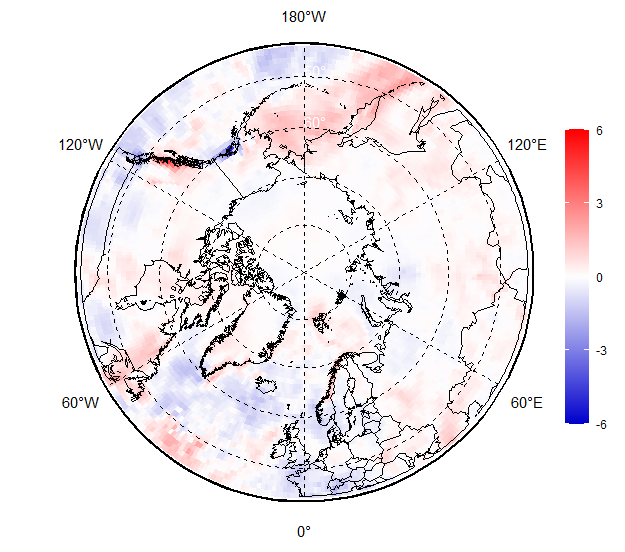
The figure below shows February, March, and April (FMA) 2021 precipitation based on the 1991-2020 reference period. The map produced by the Arctic and Antarctic Research Institute with ERA5 as data source. The imaged can be clicked to show the forecast precipitation for the same period.
During this period, wetter than normal conditions were observed in the Alaska, Bering and Chukchi, Central Canada and Svalbard regions (red areas in the figure below), while Western and Eastern Siberia regions experienced drier than normal conditions (blue areas in the figure below). Siberian shelf seas, Sea of Okhotsk, and the Nordic region experienced both wetter and drier conditions.
Click image to see forecast and climate summary side by side.
×
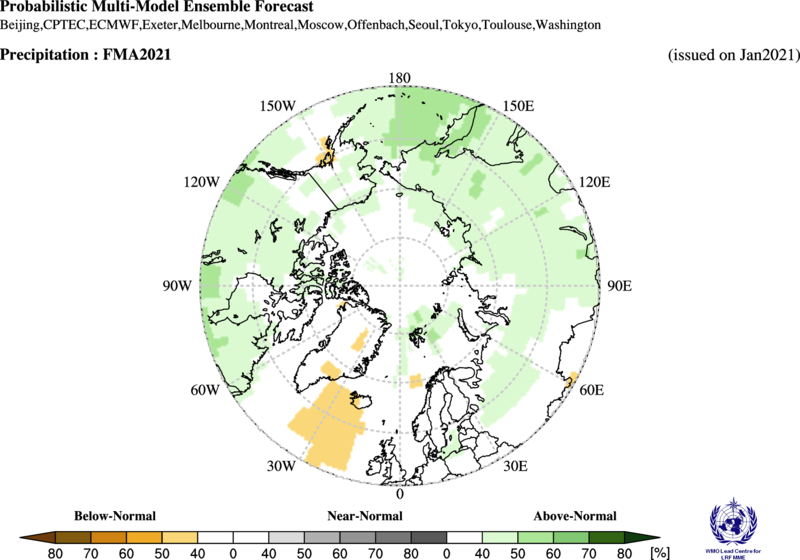
Forecasted precipitation for February, March and April 2021.
Precipitation summary for the same period.
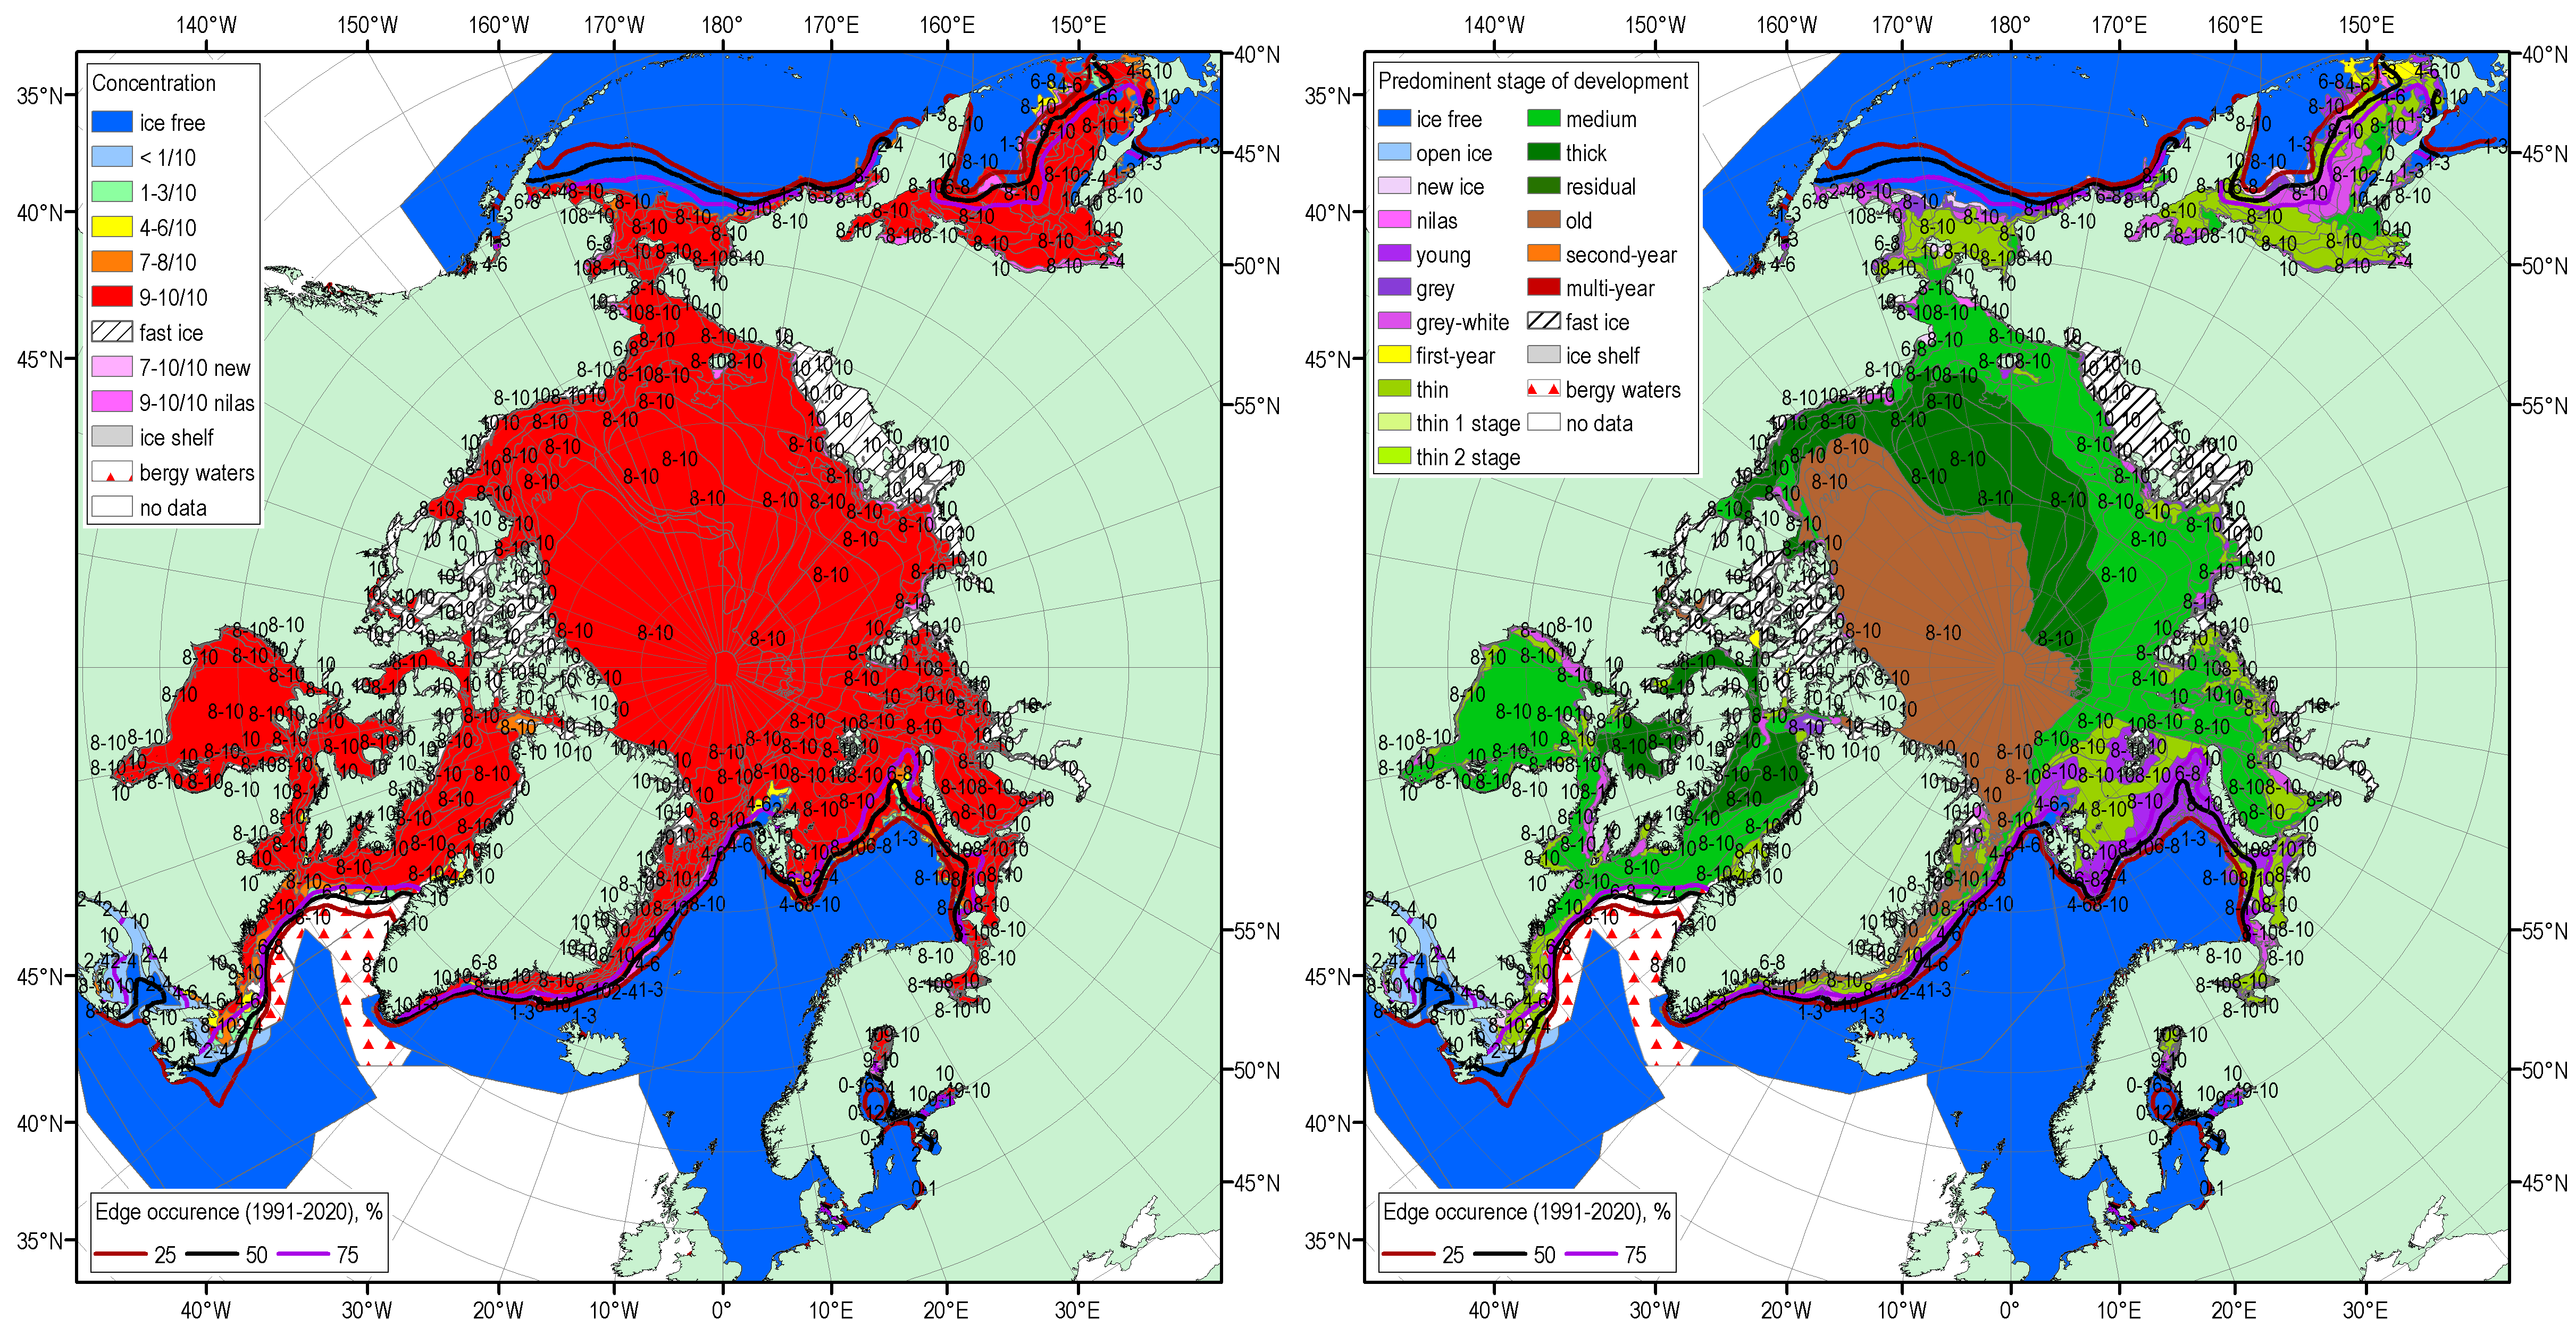
Sea Ice Summary for March 2021
The figure below shows the blended Arctic ice chart (AARI, CIS, NIC) and ice edge occurences for 15-18 March with reference period 1991-2020, with total concentration to the left, and predominant stage of development to the right. The ~15.1-15.3 million km2 (based on NSIDC passive microwave estimates or sea ice analysis) maximum winter ice extent was reached 11 March 2021, being 7th in row, compared to ~15,4 in 2020, 16th in row, reached 4 March in 2020. The 2021 maximum only slightly correlates with summer 2020 conditions, which ranked as the 2nd lowest sea ice extent. During the freezing period, close to the lowest on record Arctic ice extent and ice volume were observed in October-mid November in the Eurasian Arctic, due to drastically reduced ice cover, accumulated heat content and positive SAT anomalies.
No long-range forecast for sea ice for this period.