
This is the main result from the climate summary stated in the ACF-6 Consensus statement, for temperature and precipitation during June, July and August 2020, and sea ice for September 2020. View the full climate summary presentation for more details. The combination of an Arctic meridional atmospheric circulation (north-south) and high ocean surface heating this summer was the main driver of this past season’s temperature, precipitation and sea ice anomalies.
Temperature JJA 2020 Summary
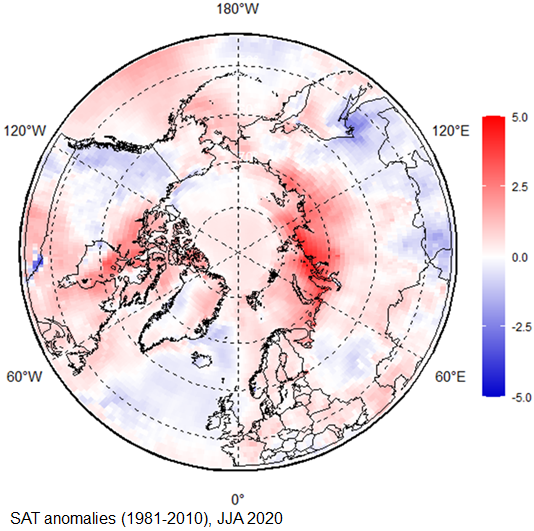
The figure below shows June, July and August (JJA) 2020 surface air temperature anomaly based on the 1981-2010 reference period. Red indicates warmer than normal temperatures, and blue indicates cooler than normal temperatures. The map is produced by the Arctic and Antarctic Research Institute http://www.aari.ru with ERA-5 as data source.
The June, July, and August (JJA) 2020 average surface air temperatures in the Arctic north of 65°N was above normal over most of the region, including Western and Eastern Siberia, the Chukchi and Bering region, and the central part of the Canadian Arctic (red areas). A persistent high atmospheric pressure over the Central Arctic and Eastern Siberia regions through the summer, combined with low atmospheric pressure over the Alaska and Western Canada region (ERA5, not shown here), led to several heat waves in Eastern Siberia in June and July 2020 and record high temperatures in Eastern Siberia (+38 °C at Verkhoyansk on 20 June). In turn, this atmospheric pattern resulted in slightly below normal surface air temperatures over Western Canada and a portion of the Norwegian Sea (light blue areas).
Click image to see forecast and climate summary side by side.
×
Forecasted temperature for June, and August 2020.
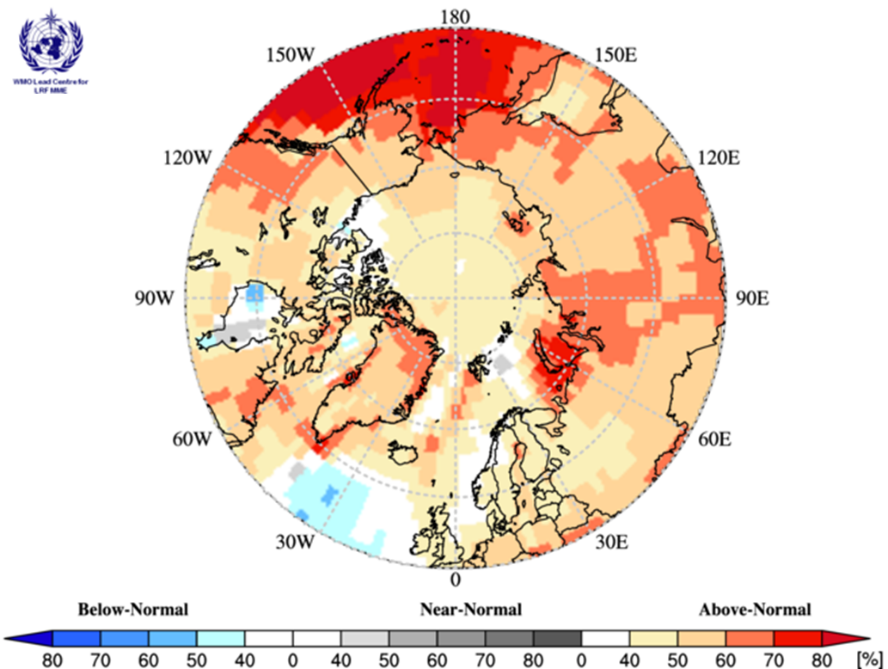
Temperature summary for the same period.
Precipitation JJA 2020 Summary
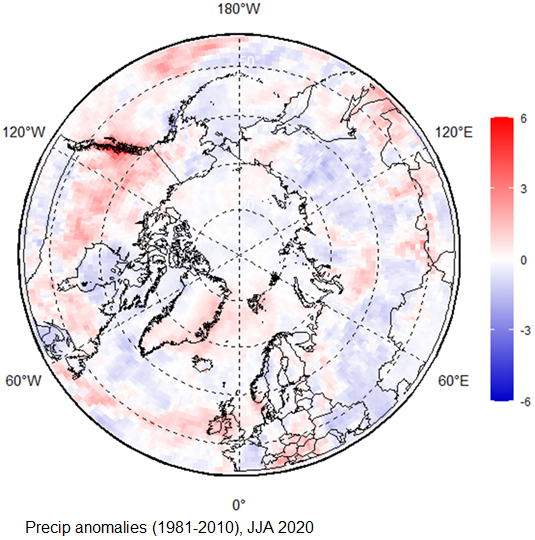
The figure below shows JJA 2020 precipitation based on the 1981-2010 reference period. Red indicates wetter than normal conditions, and blue indicates drier than normal conditions. The map is produced by the Arctic and Antarctic Research Institute http://www.aari.ru with ERA-5 as data source.
Wetter than average conditions were observed during June, July, and August 2020 (JJA) 2020 over the Western Nordic, and Alaska and Western Canada regions (red areas). On the other hand, the majority of the Eastern and Western Siberia regions, along with the Chukchi and Hudson Bay area, experienced drier than average conditions (blue areas). The impacts of wetter/drier regions were reflected in the JJA 2020 Arctic rivers discharge: lesser drainage than normal is seen in Ob’, Enisey and Lena rivers, and further eastward, while the Mackenzie and Yukon rivers experienced greater discharge than normal over that same time period (not shown here). The snow extent in May-September 2020 was lower than normal, with extreme negative anomalies (no snow) observed in most of Siberia and Alaska (Rutgers Glob SnowLab). Positive anomalies (more snow) were observed in May in parts of Scandinavia, Eastern Canada, and in September in Northern Canada (not shown here).
Click image to see forecast and climate summary side by side.
×
Forecasted precipitation for June, July and August 2020.
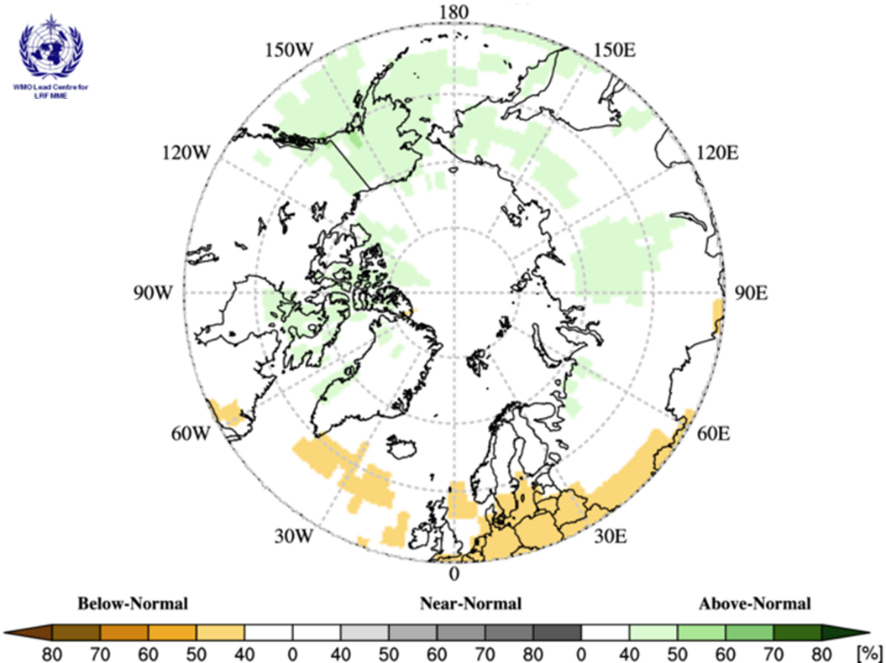
Precipitation summary for the same period.
Sea Ice Summary for September 2020
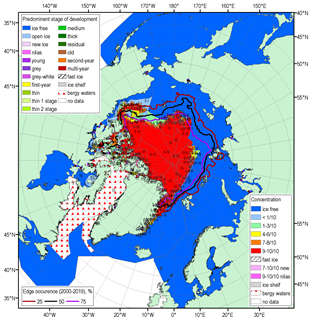
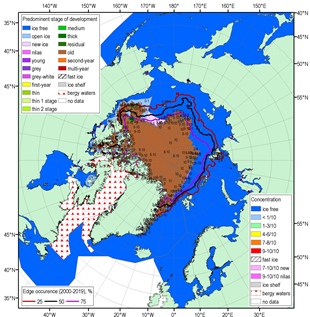
The figure below shows the blended Arctic ice chart (AARI, CIS, NIC) for 14-17 September 2020 and sea-ice edge occurrences for 14-17 September for 2000-2019, with total concentration (top), and predominant stage of development (bottom).
Sea surface temperature (SST) anomalies and the heat content (HC) of the upper layer of the polar ocean influences the melting and growth of sea-ice. High positive SST anomalies and prevailing positive polar ocean upper layer (20 m) HC during June-August 2020 (MERCATOR Ocean reanalysis, not shown here) simulated the melting of sea-ice in parts of the Kara and Laptev Sea. On the other hand, near normal to below normal SST and HC anomalies over that same time period slowed the melting of sea-ice in the Beaufort and Chukchi Seas.
The 3.9 mln km2 minimum sea-ice extent reached on September 12, 2020 is the second lowest minimum sea-ice extent since 1979, with the minimum summer sea-ice extent observed in 2012 (3.35 mln km2). Estimates of the sea-ice volume based on numerical reanalysis (HYCOM-CICE, PIOMAS) show that the 2020 sea-ice volume is the second lowest, with 2012 and 2016 tied for lowest. The 2020 sea-ice is not considerably lower than that of 2019, suggesting higher summer sea-ice thickness in 2020 compared to 2019. However, extreme reduction of the Arctic sea-ice cover this summer significantly differs in shape with that of 2019. While the Eurasian shelf seas and the Northern Sea Route were completely ice free, sea-ice conditions in the Beaufort Sea and the Canadian Archipelago were close to normal, with the Northwest Passage closed.
No long-range forecast for these sea ice charts for this period.