
This is the main result from the climate summary stated in the ACF-5 Consensus statement, for temperature, precipitation and sea ice during February, March and April 2020. View the full climate summary presentation for more details.
Temperature FMA 2020 Summary
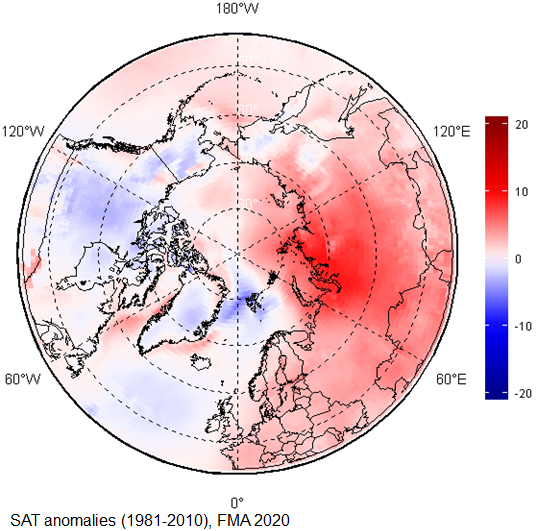
The figure below shows February, March, and April (FMA) 2021 surface air temperature (SAT) anomaly based on the 1981-2010 reference period. The map is produced by the Arctic and Antarctic Research Institute with ERA5 as data source. The imaged can be clicked to show the forecast temperature for the same period.
The average surface air temperatures in the Arctic north of 65°N ranged from higher than normal in the eastern hemisphere, to lower than normal in the western hemisphere. Due to very low atmospheric pressure on the Eastern side of the Arctic (ERA5, not shown here), Scandinavia and the majority of the Eastern and Western Siberia regions experienced warmer than normal conditions (red areas in the figure below), while the majority of Canada, Alaska, Greenland, and the North Atlantic Ocean experienced near normal (white areas in the figure below) or slightly below normal (light blue areas in the figure below) conditions. Using data from NCEP/NCAR reanalysis to rank the average surface air temperature, the boundary between Eastern and Western Siberia saw their second warmest FMA period, on average, since the start of the record in 1949 (not shown).
Click image to see forecast and climate summary side by side.
×
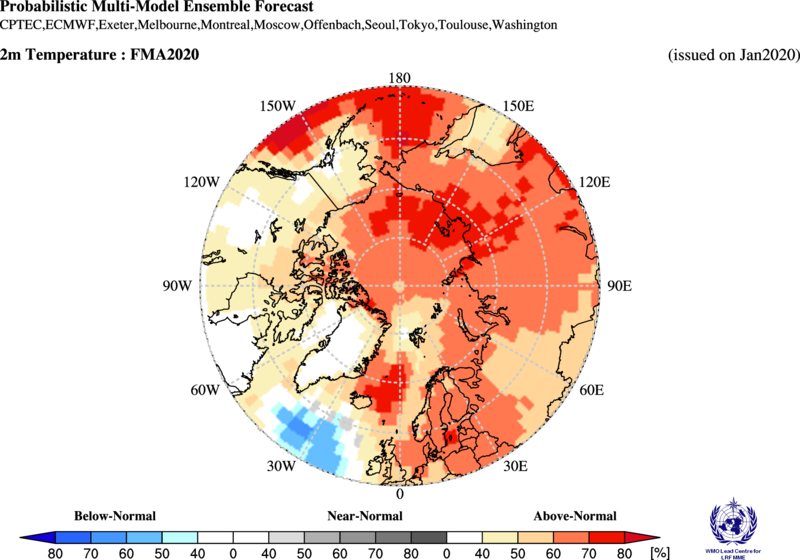
Forecasted temperature for February, March and April 2021.
Temperature summary for the same period.
Precipitation FMA 2020 Summary
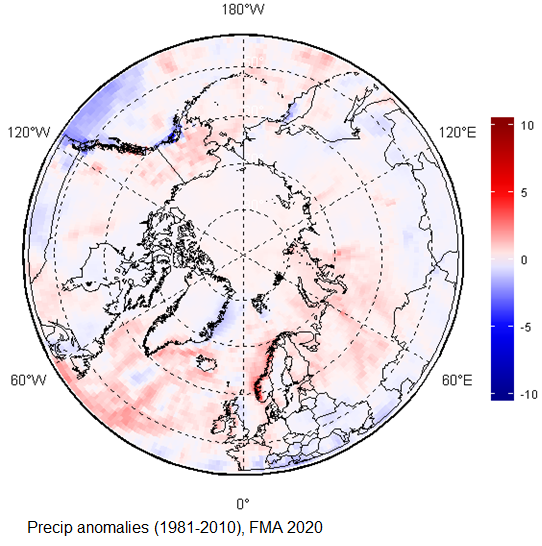
The figure below shows February, March, and April (FMA) 2020 precipitation based on the 1981-2010 reference period. The map produced by the Arctic and Antarctic Research Institute with ERA5 as data source. The imaged can be clicked to show the forecast precipitation for the same period.
Wetter than average conditions were observed during this period across the majority of Arctic region (red areas in the figure below). Only a few isolated areas, including the northeastern coast of Greenland, northern Canada, and a small swath over southern Alaska, experienced drier than average conditions (blue areas in the figure below).
Click image to see forecast and climate summary side by side.
×
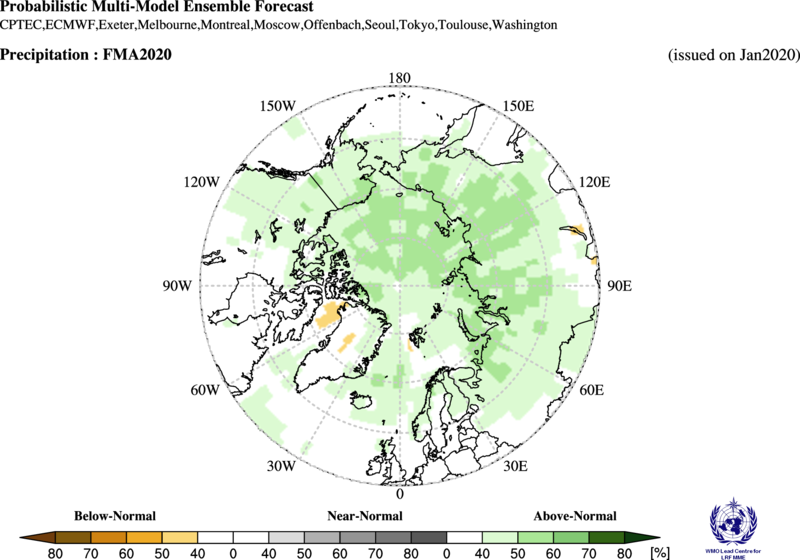
Forecasted precipitation for February, March and April 2020.
Precipitation summary for the same period.
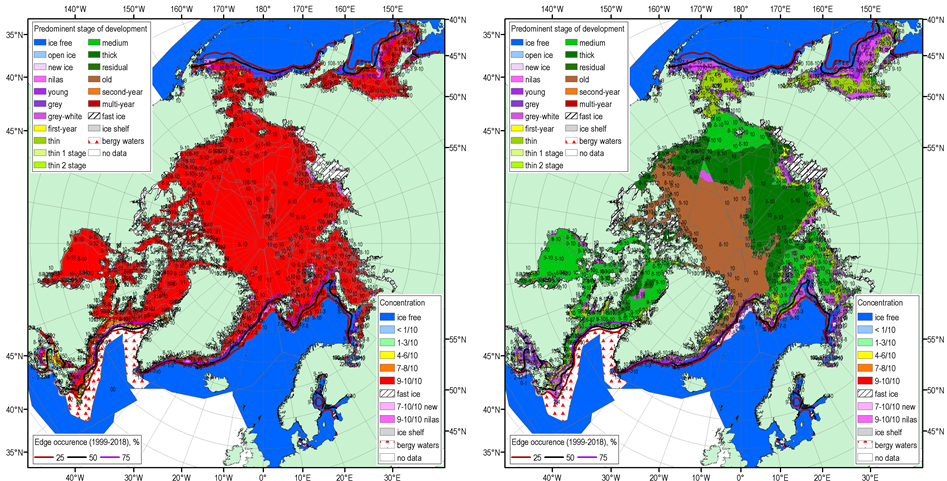
Sea Ice Summary for March 2020
The figure below shows the blended Arctic ice chart (AARI, CIS, NIC) for 16-19 March 2020 and ice edge occurences for 16-20 March for 1999-2018, with total concentration to the left, and predominant stage of development to the right. The 15.1 mln km2 maximum sea-ice extent reached on March 5, 2020 is the 11th lowest maximum sea-ice extent since 1979 (2019 – 7th), with the maximum winter sea ice extent observed in 1979 (16.77 mln km2). Nevertheless, estimates of the sea ice volume based on numerical reanalysis (HYCOM-CICE, PIOMAS) show that the 2020 sea ice volume was similar to that of 2019, a year with one of the lowest sea ice volume on records. Similarly, maximum winter ice thicknesses observed at coastal stations were in general significantly thinner on the Siberian side of the Arctic (up to - 50 cm for Kara Sea).
No long-range forecast for sea ice for this period.