
This is the main result from the climate summary stated in the PARCOF-2 Consensus statement, for temperature, precipitation and sea ice. View the full climate summary presentation for more details. The June to August 2018 average surface air temperature anomalies were above average for most of the Arctic domain, with the exception of parts of the Canadian Arctic and central Greenland, which experienced colder than normal temperatures. Precipitation between June and August 2018 was slightly below average over the Arctic region. The summer 2018 minimum sea ice extent was the 6th lowest on record, tied with 2008, since 1979. There were large regional differences observed in sea ice conditions between the Canadian and Eurasian Arctic during summer 2018. Above normal ice extent in the eastern Beaufort Sea and throughout the North West Passage had a major impact on the 2018 shipping season resulting in the North West Passage remaining blocked for ice free navigation.
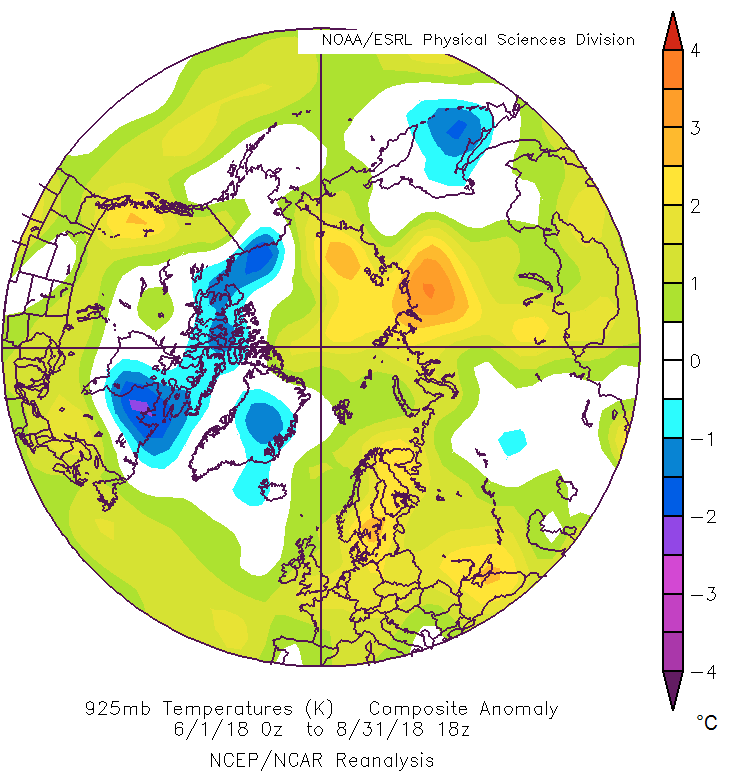
Temperature JJA 2018 Summary
The June, July, and August (JJA) 2018 average surface air temperature in the Arctic domain north of 65°N ranged between the highest (eastern Siberia) to the 17th highest (Canadian Arctic) warmest summer in 69 years, since the start of the record in 1949. The JJA 925 mb air temperature anomalies is based on the 1981-2010 reference period from NCEP/NCAR Reanalysis. The 925 mb temperature anomaly is representative of surface conditions. The figure shows average or above average temperatures for most of the Arctic domain, with the exception of parts of the Canadian Arctic and central Greenland, where temperatures were below normal. Data from NCEP/NCAR reanalysis was also used to rank the 2-m surface temperatures since 1949. Between May and September 2018, most of Scandinavia, northern Siberia, the Arctic Ocean, the Chukchi and Beaufort Seas, as well as the North Pole, experienced their warmest year since 1949, while parts of the eastern Canadian Arctic and southern Greenland experienced their coldest temperatures since 1949. Click image to see forecast and climate summary side by side.
Click image to see forecast and climate summary side by side.
×
Forecasted temperature for June, July and August 2018.
Temperature summary for the same period.
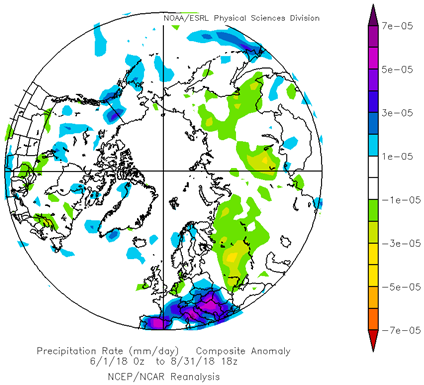
Precipitation JJA 2018 Summary
The figure shows the JJA 2018 precipitation anomaly based on the 1981-2010 reference period from NCEP/NCAR Reanalysis. Lower than average precipitation was observed over Siberia (yellow and green ares), while close to normal and slightly above average values were observed in the Atlantic, Northern European and Canadian Arctic regions (green areas). Taken as a whole however, the Arctic region experienced lower than average precipitation for that same time period. Data from NCEP/NCAR reanalysis was also used to rank precipitation since 1949. The Chukchi Sea region and northwestern Siberia saw their driest summer in the 69 year record. Click image to see forecast and climate summary side by side.
Click image to see forecast and climate summary side by side.
×
Forecasted precipitation for June, July and August 2018.
Precipitation summary for the same period.
Sea Ice Summary for September 2018
Blended Arctic ice chart (AARI, CIS, NIC) for 17-20 September 2018 and ice edge occurrences for 16-20 September for 1998–2017 are shown in the figure above. The summer 2018 minimum sea-ice extent was reached on September 16, 2018, making 2018 the 6th minimum sea-ice extent in the 39 year record which started in 1979. Estimates of the sea ice volume, based on numerical reanalysis (HYCOM-CICE, PIOMAS), show a similar 6th minimum sea-ice extent in row since 1979 and higher ice thicknesses in comparison to 2017. A precursor for higher sea ice thicknesses in the Central Arctic could be due to the higher precipitation amounts observed prior to the sea-ice melt season (April). High spatial variability in sea ice conditions between the Canadian and Eurasian Arctic was observed during the entire 2018 summer period. Sea ice extent for the Canadian Arctic was higher than the last decade’s median extent, with the Northwest Passage remaining blocked for ice free navigation. Simultaneously, parts of the Eurasian Arctic (southeastern Barents, Kara, and Eastern Siberian Seas) showed close to the 1998-2017 median ice coverage until the middle of July, with further extreme low sea ice extent in the most parts of this region until the end of September. Until the end of October 2018, persistent strong westerly winds (North Atlantic Oscillation index - NAO>0) continued to generate a positive surface air temperature anomaly over the Eastern and Central Arctic (with the exception of the Canadian archipelago and the Hudson Bay regions), slowing the sea ice formation process in those areas.
No long-range forecast for sea ice for this period.