
On polarportal.dk, Danish research institutions display the results of their monitoring of the Greenland Ice Sheet and the sea ice in the Arctic. The main purpose of the site is to make updated information from this monitoring available to the general public, both nationally and internationally. In addition, the site will provide access to scientifically based information resources.
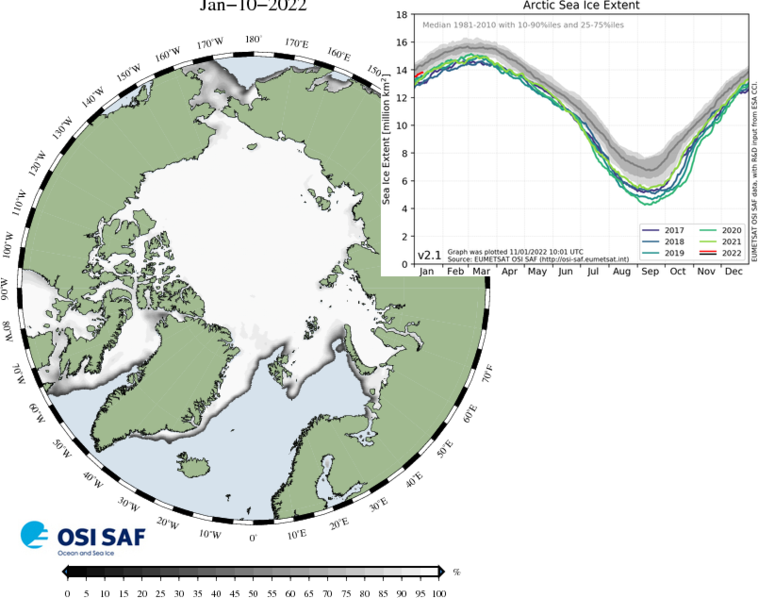
The map shows the sea ice extent in the Northern Hemisphere. It is updated on a daily basis. The graph shows the annual variation in the extent of the sea ice in the Northern Hemisphere. The extent of the sea ice is defined by areas that have an ice concentration of at least 15%, i.e. 15% of the surface is covered by ice. The grey band around the climatological mean value corresponds to plus/minus one standard deviation. The extent of the ice is based on satellite data and are from the Ocean and Sea Ice, Satellite Application Facility project (OSISAF). Read more about the data the map is based on at DMI. Image retrieved from http://polarportal.dk/en/sea-ice-and-icebergs/sea-ice-extent0/.
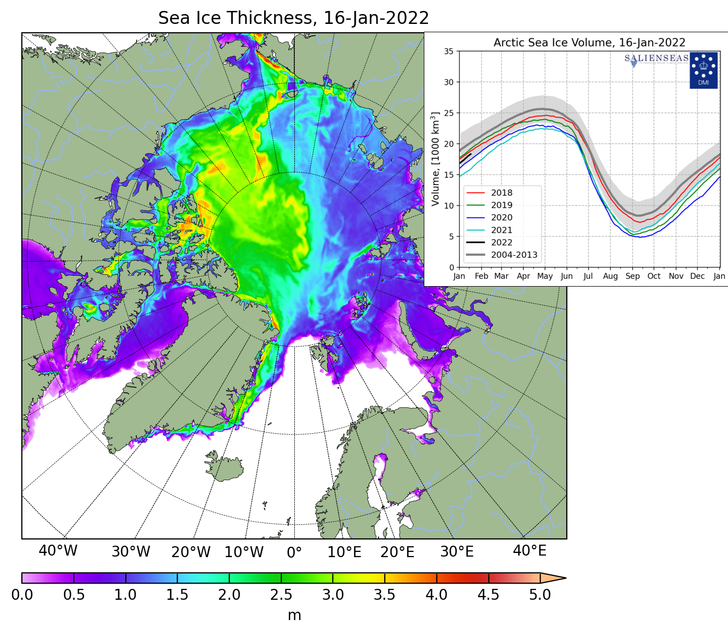
The map illustrate the sea ice thickness in the Northern Hemisphere, excluding the Baltic Sea and the Pacific, and is updated on a daily basis. The data is based on DMI’s model calculations. Read more about the data the map is based on at DMI. Image retrieved from http://polarportal.dk/en/sea-ice-and-icebergs/sea-ice-thickness-and-volume/.
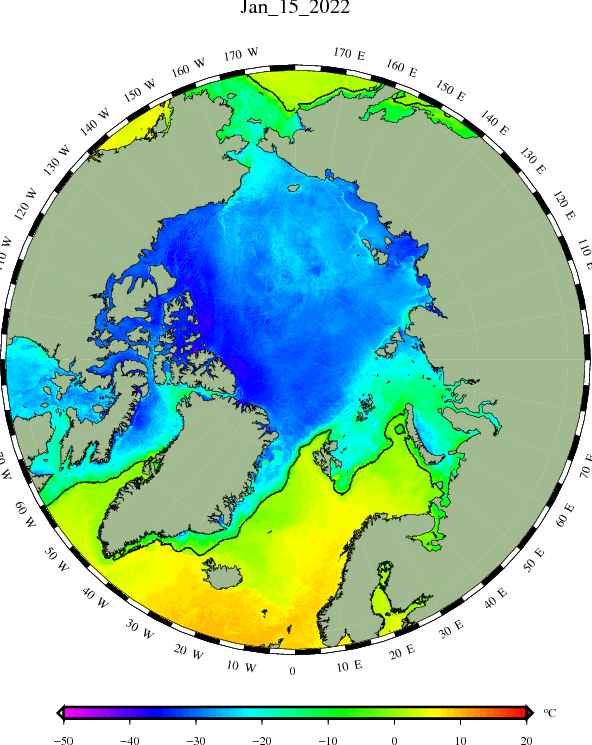
The figure shows the mean temperature of the sea ice and the surface of the sea based on satellite observations during the past 36 hours. The surface temperature of the ice has a great influence on the exchange of heat between the surface and the atmosphere, and thereby also the rate of increase of the sea ice volume.
This integrated Ice and Sea surface temperature product is part of the EU satellite monitoring program for marine environment, Copernicus CMEMS. The product is based on the OSI-205 product from EUMETSAT Ocean and Sea Ice Satellite Application Facility (EUMETSAT, OSI SAF). The figure shows the latest 36-hour sliding mean temperature of the ice- and ocean surface. Image retrieved from http://polarportal.dk/en/sea-ice-and-icebergs/sea-ice-temperature/.